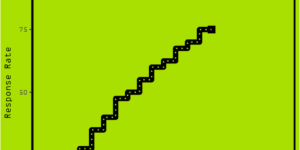
Retro gaming step chart
Recently at work I was tracking the response rate of a survey, so I put together a step chart to keep track of it. Here’s a simulated version of what …
Recently at work I was tracking the response rate of a survey, so I put together a step chart to keep track of it. Here’s a simulated version of what …
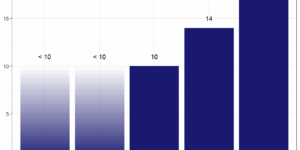
Suppression in data visualisation Many public organisations follow data suppression rules for tabular aggregate data, for example the Australian Bureau of Statistics. And those that don’t really should. But most guidance …
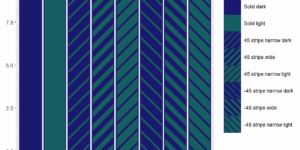
Accessibility is an important part of data visualisation, and one common piece of advice to improve accessibility for people who are colourblind or have other visual impairments is to use …
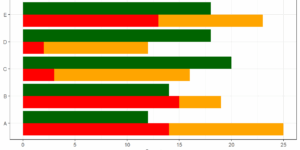
I recently had reason to combine stacked and dodged bar charts in ggplot. Why might one want to do this? Well, in my case I had some data that contained …